
Every year, the US Census Bureau releases data from the Public Use Microdata Sample (PUMS), a housing unit and population survey that the NC Housing Finance Agency uses to measure trends in housing affordability and economic security across North Carolina.[i] A July 2023 Policy Matters Blog leveraged this data to better understand the prevalence and geographic distribution of housing unaffordability, finding that nearly one million low-income North Carolinians live in unaffordable housing.
Additional analysis of this data reveals important dimensions of the state’s housing affordability crisis and can specifically help answer the question of who is struggling the most with housing costs. The focus of this analysis is on housing cost burden, a measure of housing affordability that considers the percentage of income a household spends on housing costs. A household is considered cost-burdened if it spends 30% or more of household income on housing costs and severely cost-burdened if it spends 50% or more of household income on housing costs.[ii] The negative consequences of a household being cost-burdened, especially for lower income households, are well-documented. For example, a 2020 study by Harvard University’s Joint Center for Housing Studies found that severely cost-burdened low-income families spend 52% less on food, health care and transportation than low-income counterparts who live in affordable housing. This reduction in spending on critical goods and services often translates to adverse health and economic outcomes for children and families.[iii]
1. Renters Are Much More Likely to Face Housing Unaffordability than Homeowners
Renters, who make up more than 30% of North Carolina’s population, are especially likely to live in unaffordable housing. According to analysis of the 2021 PUMS data, North Carolina renters are more than twice as likely as homeowners to report housing cost burden (spending 30% or more of household income on housing costs): 46% of renter households compared to 20% of homeowners.
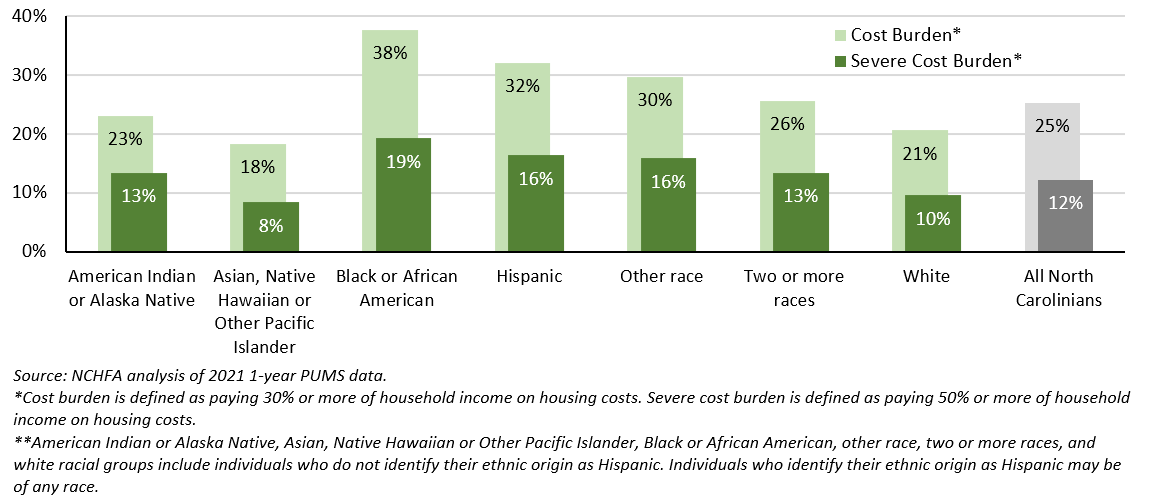
2. Racial and Ethnic Disparities in Housing Unaffordability are Severe
While housing unaffordability is experienced by individuals of all races and ethnicities in North Carolina, Black and Hispanic North Carolinians are especially likely to experience cost burden: 38% of Black residents and 32% of Hispanic residents experience housing cost burden, compared to a range of 18–30% of residents from other racial groups. These trends are consistent for both renters and homeowners and across all income groups.
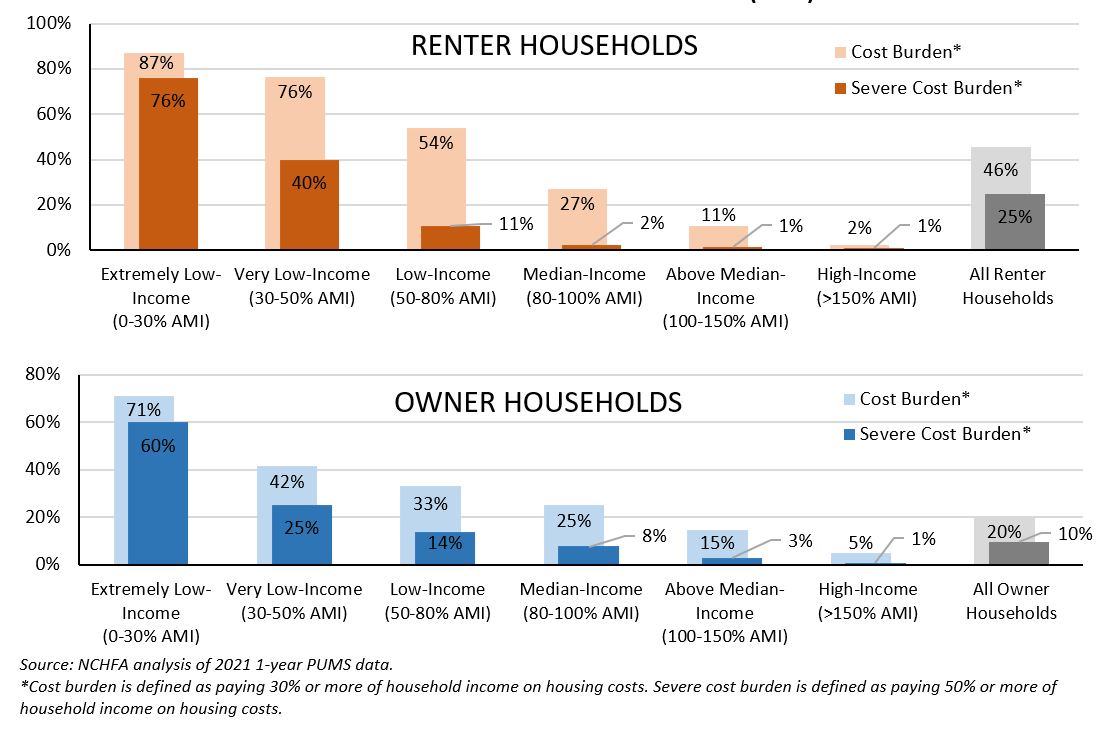
3. Households with Low Incomes Struggle to Afford Housing, Regardless of Tenure
In North Carolina, households with low incomes are more likely than higher income households to live in unaffordable housing. For example, 87% of extremely low-income renter households (earning ≤30% of area median income (AMI)) and 76% of very low-income renter households (earning 30-50% of AMI) are cost burdened, while only 2% of high-income renter households (earning >150% of AMI) experience cost burden. This trend is consistent for the state’s homeowner households, as well.
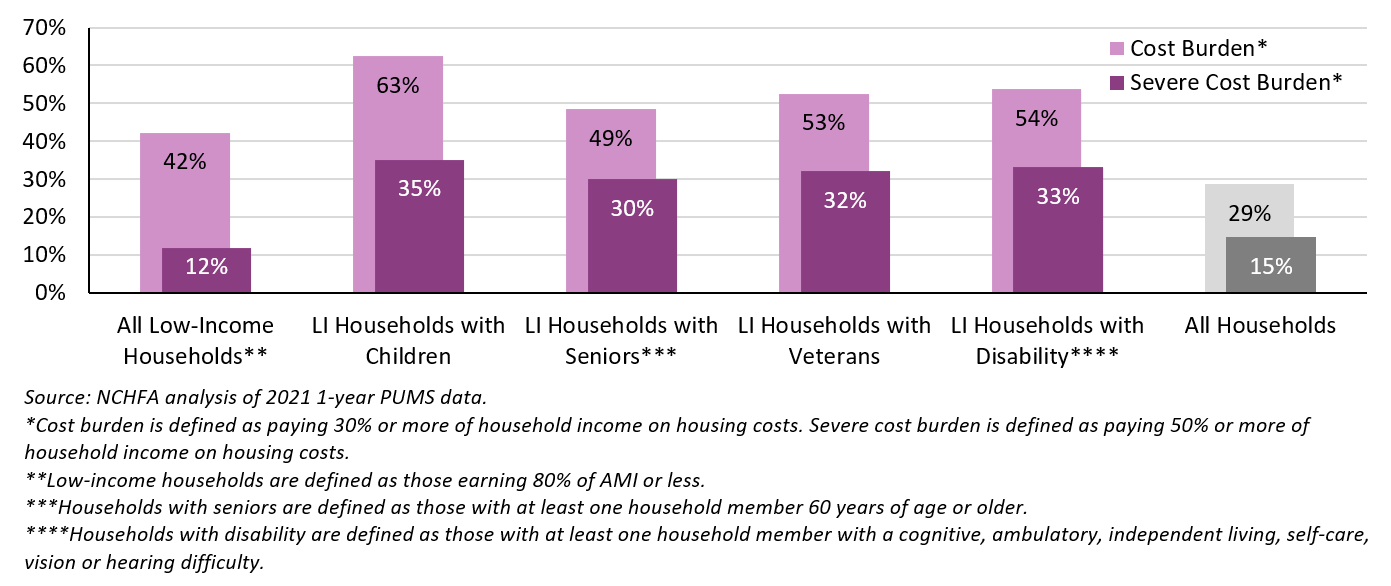
4. North Carolina Low-Income Households in All Types of Families Experience Housing Unaffordability
Families of all types need affordable, safe and stable housing in order to thrive. A large and growing body of research has found that housing affordability is essential for children: living in affordable and stable housing promotes positive economic and health outcomes for North Carolina children, including but not limited to, performing better academically, experiencing fewer physical and mental health issues and increasing long-term earnings.[iv] For adults, access to an affordable and stable home is linked with increases in mental and physical health, increases in job performance and longevity, decreases in lengths of joblessness and sharp reductions in homelessness and poverty.[v]
North Carolina low-income households of all types and sizes experience housing affordability challenges. These challenges are especially prevalent for households with children: in 2021, more than three out of every five low-income households with children (63%) experience cost burden. Low-income households with disabilities, veterans and seniors also experience high rates of cost burden: 54%, 53% and 49%, respectively.
Conclusion
Cost burden alone does not fully consider the many dimensions of housing hardship, including the impacts of housing quality and neighborhood. For example, while a home may be affordable based on cost alone, it might be in disrepair or lack critical facilities (e.g., plumbing or a full kitchen), be located far from employment opportunities or lack access to critical community amenities like grocery stores, schools and transportation infrastructure. In fact, a household may choose or be limited to lower quality or less location-efficient housing to reduce housing costs. Therefore, while cost burden is an important and useful measure of housing affordability, it is necessarily incomplete. For this reason, the Policy Matters Blog seeks to share analysis and research on the many dimensions of housing affordability. See, for example, the November 2023 post on recent demographic changes in North Carolina, the June 2023 post on the prevalence of substandard housing in North Carolina, the March 2023 post on the relationship between housing insecurity and child well-being or the July 2022 post on the increasing costs of home ownership in North Carolina and hurdles for first-time homebuyers.
The Agency offers an array of financing options designed to help address these housing affordability and instability challenges, and create more affordable rental and home ownership opportunities for North Carolinians. For more information on the Agency’s programs, visit www.nchfa.com.
[1] [i] This analysis uses data from the American Community Survey (ACS) Public Use Microdata Sample (PUMS). The ACS is an ongoing, annual survey conducted by the U.S. Census Bureau that collects detailed population and housing data on households throughout the United States. Whereas the ACS aggregates data to a specific geography (state, county, zip code, census tracts, etc.) and releases results only in a pretabulated form, PUMS data is available at the individual and housing unit levels, offering the ability to work directly with the underlying ACS data for more complex analysis.
[ii] Housing costs include rent, mortgage payment, utilities, homeowners insurance, property taxes, etc.
[iii] Joint Center for Housing Studies of Harvard University. 2020. “The State of the Nation’s Housing: 2020.” Website: http://www.jchs.harvard.edu/state-nations-housing-2020.
[iv] See, for example: Jacob, Brian, Max Kapustin, and Jens Ludwig. 2015. “The Impact of Housing Assistance on Child Outcomes: Evidence from a Randomized Housing Lottery.” The Quarterly Journal of Economics; Aizer, et al. 2014. “The Long-Term Impact of Cash Transfers to Poor Families.” NBER Working Paper 20103; Chetty, Raj, John Friedman, Nathaniel Hendren, Maggie R. Jones, Sonya R. Porter. 2018. “The Opportunity Atlas: Mapping the Childhood Roots of Social Mobility.” Website: https://scholar.harvard.edu/files/hendren/files/atlas_paper.pdf
[v] See, for example: Desmond, Matthew, and Carl Gershenson. 2016. “Housing and Employment Insecurity among the Working Poor.” Social Problems. doi: 10.1093/socpro/spv025; Kavanagh, Anne, et al. 2016. “Housing tenure and affordability and mental health following disability acquisition in adulthood.” Social Science & Medicine Volume 151, 225-232: https://www.sciencedirect.com/science/article/abs/pii/S0277953616300107; Pollack, Craig, et al. 2010. “Housing affordability and health among homeowners and renters.” American Journal of Preventive Medicine 39(6): 515-21. doi: 10.1016/j.amepre.2010.08.002; Gubits, Daniel, et al. 2015. “Family Options Study: Short-Term Impacts of Housing and Services Interventions for Homeless Families.” Prepared for Department of Housing and Urban Development. Website: https://www.huduser.gov/portal/sites/default/files/pdf/FamilyOptionsStudy_final.pdf.