
Diving into the home buying process requires a household to consider and track multiple household and market-level factors that can put home buying in or out of reach. News articles regularly discuss mortgage interest rates, home prices, wage trends and insurance costs, but determining the cumulative impact of these market conditions on a local home buyer can be difficult. The Federal Reserve Bank of Atlanta created the interactive Home Ownership Affordability Monitor to illustrate these dynamics for metro markets across the US, providing an interesting glance into how the monthly interaction of interest rates, pricing, taxes and income shapes local market affordability.
For North Carolina, 31 metro markets (inclusive of 61 counties) are included in the affordability monitoring data tool. The interactive tool not only explores the range of median home prices across markets, but also provides important market-based context showing how these prices fit with the median incomes earned in that market.
One such featured metric is called the affordability gap; it measures the difference between the actual median household income in an area and the qualified income (the income a household would need to qualify for a mortgage on a median priced home). A gap of 1.00 or less means median priced homes are generally affordable for median income buyers, while a gap greater than 1.00 indicates that median home prices exceed what a median income buyer can afford. For example, Hickory-Lenoir-Morganton’s median home price ($281,000) is $116,083 less than Charlotte-Concord-Gastonia’s ($397,083). While the market median home prices differ, they are similarly unaffordable for households earning median incomes. In both markets, the gap is roughly 1.4, meaning that home buyers need 1.4 times (140%) their market’s median income to purchase a median priced home. See Figure 1 below.

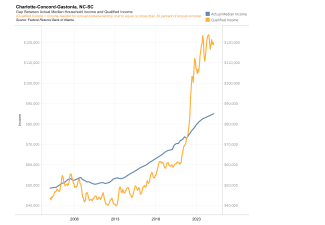
While these graphs show both a widening affordability gap between median home price and median income, they also show that this was not always the case. In 2021, both markets had median home prices that were affordable to households with median incomes. The Charlotte market shifted mid-2021 and Hickory’s in the first part of 2022 to no longer have price and income in step with one another.
While the Hickory-Lenoir-Morganton and Charlotte-Concord-Gastonia example shows two markets with similar levels of unaffordability amid very different median home prices, there are other examples of widely varied affordability levels in similarly priced markets. For example, the median home price in Rocky Mount and Laurinburg are incredibly similar—$199,500 and $205,000, respectively—but affordability varies widely.
In Rocky Mount, households earning the median income can afford a median priced home, while in Laurinburg, households earning the median income need 1.43 times the median income to purchase a median priced home.
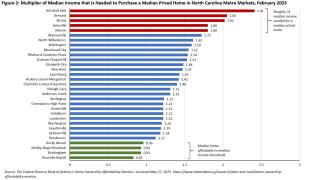
Nationally, a home buyer needs to earn about one and a half (1.53) times the national median income to afford a median priced home. In ten of North Carolina’s metros, this gap is even larger (e.g., Kill Devil Hills (2.41), Brevard (2.04), Boone (2.02); see Figure 2 below for data on all NC metros). While this can mean homes in these ten markets are priced higher than the national median, it can indicate other patterns, often meaning that there is a greater mismatch between home prices and incomes than there is nationally.
The affordability gap plays out differently in various metro areas across the state, with some eastern markets maintaining a close match between the median incomes and median home prices while some western mountain markets and the Outer Banks feature median home prices that require at least double the median income. See Figure 2 below.
Other metrics offered by the affordability monitoring data tool include an affordability index that shows the positive and negative effects over time of price, interest rates, income, taxes and insurance on overall home affordability in these same metro markets as well as other visualizations to help understand the cost drivers and multiple pressures that are captured in the final monthly mortgage payment. Most of these metrics are examined at the median, which can serve as a good tool for simplifying the complexities found in the housing market so that trends can be detected. Even so, limitation of medians should be kept in mind, as they may mask the distribution of home prices or income, particularly in markets with small numbers of home sales or markets with a significant presence of luxury-priced homes.
Parsing out what is driving affordability helps a home buyer understand and navigate their housing market to ensure their purchase is the right one for them. Additionally, these tools help all residents understand the variation across the state in housing affordability challenges and opportunities.
The North Carolina Housing Finance Agency offers financing products to help make buying a home more affordable to qualified home buyers statewide. For both first-time and move-up home buyers, our NC Home Advantage Mortgage™ provides qualified individuals with stable, fixed-rate mortgages and down payment assistance up to 3% of the loan amount. The Agency also offers $15,000 in down payment assistance for qualified first-time and military veteran home buyers with the NC 1st Home Advantage Down Payment.
These mortgage tools and home buyer counseling can set home buyers up for success in a market that can be difficult to navigate. To learn more, visit https://www.nchfa.com/home-buyers.