
For policy makers, housing program operators and affordable housing stakeholders who need timely, reliable housing data, knowing what the housing market is doing helps decision makers develop effective ways to meet current needs and plan for the future.
There are several public data sources full of useful, reliable data, but turning that data into actionable insights can be a challenge. The North Carolina Housing Finance Agency has just released a tool to make this task easier in North Carolina: the NC Housing Snapshot.
The Housing Snapshot is an interactive, online tool showcasing data on the state of housing in North Carolina as a whole and in each of the state’s 100 counties. It brings together a wide range of data—including housing costs, vacancy rates, demographic trends and housing production—to provide a comprehensive view of housing in the state.[1]
Users can explore market conditions through customizable maps and graphics, with the ability to filter by geography and year of data. The geography filters enable users to see data for the whole state or for a single county. While the most recent years’ data are displayed by default, users can utilize the “Select Year” filter at the top of the page to observe trends over time. Information on the sources and methodology used to produce each figure can be found in the Sources and Methodology link in the bottom left corner of each page.
The data are displayed in a series of five dashboards, accessed using navigation buttons across the top of the tool.
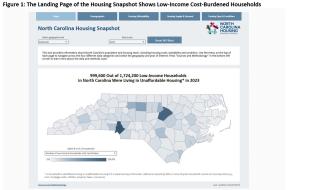
- Landing page (see Figure 1): This page shows the number and percent of low-income households who live in housing unaffordable to them.
- Demographics page: This page shows demographic information about North Carolina’s population, including tenure, household income, age and race and ethnicity. This information can provide insights into who makes up our communities, how populations are changing and what their needs might be.
- Housing Affordability page: This page shows trends in housing affordability, including housing costs, cost burden and the interplay between demographics and the market dynamics driving affordability trends.
- Housing Supply and Demand page: This page shows some of the key drivers of housing demand and supply, including population change, vacancy rates and trends in housing permit activity.
- Housing Type and Conditions: This page provides data to help people understand a housing market’s health and stability with data on the type of structures, bedroom composition, age of housing units and distribution of units lacking complete facilities.
Explore the Housing Snapshot here.
_________________________________________________________
Endnotes
[1] Data in the Housing Snapshot come originally from these public data sources:
- ACS (American Community Survey) data from the US Census Bureau
- CHAS (Comprehensive Housing Affordability Strategy) data from the US Department of Housing and Urban Development (HUD)
- PUMS (Public Use Microdata Sample) data from the US Census Bureau
- Building Permit Data from the US Census Bureau
- PIT Count (Point-In-Time Count) homelessness data from HUD, originally from the Continua of Care in North Carolina
- Redfin data on home purchases
More information on the sources and methodology used to produce each figure can be found in the Sources and Methodology document linked in the bottom left corner of each page.